Alignment example
This page builds a synthetic data set with numpy, aligns it, and checks the answer against the truth that went in. Everything runs as-is – no data files needed – so you can paste it into a session and watch it work.
The problem we are setting up
250 stars in a 1000-pixel field, observed at four epochs two years apart. Each epoch is deliberately given its own coordinate system – a shift of up to 40 pixels, a rotation of up to 0.7 degrees about the field centre – because that is the situation FlyStar exists to resolve. On top of that, each star has a small proper motion, each measurement has 0.05 pixel noise, and roughly 12% of stars go undetected in any given epoch.
import numpy as np
from flystar import align, starlists, transforms

rng = np.random.default_rng(42)
N, YEARS, ERR = 250, np.array([2015.0, 2017.0, 2019.0, 2021.0]), 0.05
t0 = YEARS.mean()

# Truth: positions at t0, proper motions, magnitudes.
x0 = rng.uniform(0, 1000, N); y0 = rng.uniform(0, 1000, N)
vx = rng.normal(0, 0.3, N);   vy = rng.normal(0, 0.3, N)   # pixels / year
mag = rng.uniform(12, 19, N)
names = np.array([f'S{j:03d}' for j in range(N)])

# Each epoch gets its own frame: a shift plus a small rotation.
shift_x = np.array([0., 18., -25., 40.])
shift_y = np.array([0., -12., 30., -20.])
angle = np.deg2rad(np.array([0., 0.3, -0.5, 0.7]))
Names are not needed here
init_guess_mode='miracle' bootstraps the first transformation by
blind triangle matching on the brightest stars
(miracle_match_briteN()) – it uses only positions and
magnitudes, so the lists need share no naming scheme at all. That is the
realistic case: separate reductions rarely agree on labels.
If your lists do carry consistent names, init_guess_mode='name' is
cheaper and more robust. It has one sharp edge – ignore_contains,
default 'star', excludes any name containing that substring, since
auto-detected star_1, star_2, … are per-epoch detection indices
rather than identities. Pass ignore_contains=None when your names really
are stable. See Alignment.
Building one StarList per epoch
A StarList is one epoch’s detection list. Note
meta['list_time']: that is how the motion fit learns when each list was
taken, and it is a decimal year in UTC (see StarList and StarTable).
lists = []
for i, yr in enumerate(YEARS):
    dt = yr - t0

    # Where the stars really are on the sky at this epoch.
    xt, yt = x0 + vx * dt, y0 + vy * dt

    # Now push them into this epoch's own frame: rotate about the centre,
    # then shift. This is the distortion the alignment has to undo.
    xc, yc = xt - 500., yt - 500.
    c, s = np.cos(angle[i]), np.sin(angle[i])
    xo = (c * xc - s * yc) + 500. + shift_x[i] + rng.normal(0, ERR, N)
    yo = (s * xc + c * yc) + 500. + shift_y[i] + rng.normal(0, ERR, N)

    seen = rng.random(N) > 0.12          # ~12% non-detections this epoch

    sl = starlists.StarList(
        name=names[seen], x=xo[seen], y=yo[seen], m=mag[seen],
        xe=np.full(seen.sum(), ERR), ye=np.full(seen.sum(), ERR),
        me=np.full(seen.sum(), 0.05),
    )
    sl.meta['list_time'] = yr
    lists.append(sl)
Aligning them
dr_tol, dm_tol and trans_args take one entry per iteration.
That is how the solution converges: the first pass matches loosely, because
the frames are still tens of pixels apart, and each pass afterwards tightens
the tolerance now that the transformation is better known.
msc = align.MosaicSelfRef(
    lists,
    dr_tol=[60., 10., 5.],                # match radius, pixels, per iteration
    dm_tol=[1., 1., 1.],                  # match magnitude tolerance
    trans_class=transforms.PolyTransform,
    trans_args={'order': 1},              # order 1 = shift + rotation + scale
    motion_models='Linear',               # fit x0, vx, y0, vy per star
    init_guess_mode='miracle',            # blind triangle match, no names needed
)
msc.fit()

ref = msc.ref_table
print(f"{len(ref)} stars; {int((ref['n_detect'] == 4).sum())} seen in all four epochs")
254 stars; 144 seen in all four epochs
254 rows against the 250 we injected, and 144 stars detected in every epoch – close to the \(250 \times 0.88^4 \approx 150\) you would expect from a 12% per-epoch drop-out. The handful of extra rows are stars matched in only one or two epochs.
Did it work?
The point of the alignment is that every epoch ends up in one frame. On the left, each star is measured at four visibly different places, because each epoch has its own coordinate system; grey lines join the four measurements of a single star. On the right, the same stars after transformation.
ref_table['x_orig']/['y_orig'] keep each list’s untransformed
positions, so plotting them against ['x']/['y'] is the before-and-after
directly. Both are (N_stars, N_lists), one column per epoch. We zoom into a
corner of the field, since at full scale the offsets are smaller than the point
spacing:
import matplotlib.pyplot as plt

COLORS = ['C0', 'C3', 'C2', 'C4']
WIN = (100, 320)                      # a zoomed corner of the 1000-pixel field

xr, yr = np.asarray(ref['x_orig']), np.asarray(ref['y_orig'])
xt, yt = np.asarray(ref['x']), np.asarray(ref['y'])
good = np.asarray(ref['n_detect']) == len(YEARS)
sel = (good
       & (np.asarray(ref['x0']) > WIN[0]) & (np.asarray(ref['x0']) < WIN[1])
       & (np.asarray(ref['y0']) > WIN[0]) & (np.asarray(ref['y0']) < WIN[1]))

fig, (a1, a2) = plt.subplots(1, 2, figsize=(14, 6))
panels = [(a1, xr[sel], yr[sel], 'Before: one star, four frames (grey joins the same star)'),
          (a2, xt[sel], yt[sel], 'After: all epochs in the common frame')]
for ax, X, Y, title in panels:
    if ax is a1:                       # join each star's four measurements
        for i in range(X.shape[0]):
            ax.plot(X[i], Y[i], '-', color='0.7', lw=0.8, zorder=1)
    for j, yr_lab in enumerate(YEARS):
        ax.scatter(X[:, j], Y[:, j], s=40, color=COLORS[j],
                   label=f'{yr_lab:.0f}', zorder=2)
    ax.set_xlim(*WIN); ax.set_ylim(*WIN)
    ax.set_xlabel('x (pixels)'); ax.set_ylabel('y (pixels)')
    ax.set_title(title); ax.legend(title='epoch')
plt.tight_layout()
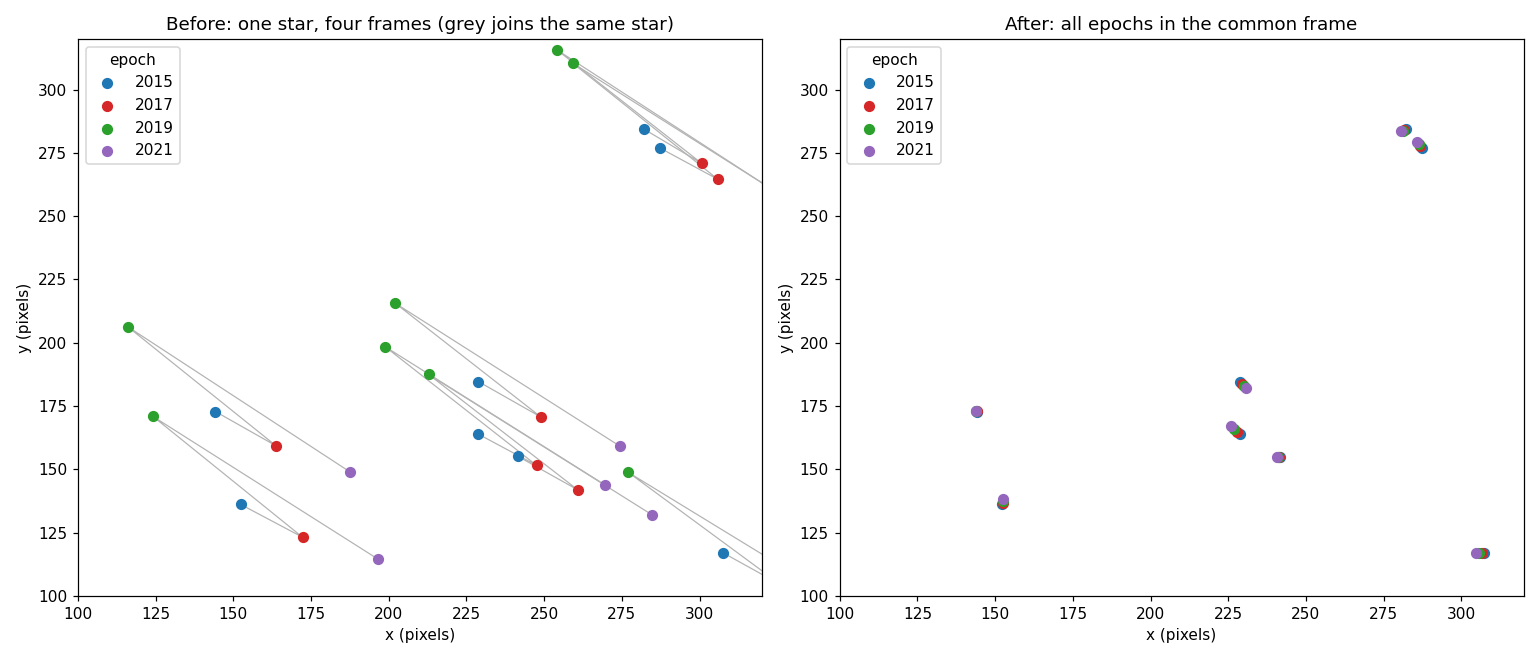
The transformed positions live in ref_table['x'] and ['y'], which are
2D, (N_stars, N_lists) – one column per epoch. The per-star averages are
x0/y0.
Residuals are the real test. Subtracting each star’s own fitted motion from its measured positions should leave nothing but noise:
good = np.asarray(ref['n_detect']) == len(YEARS)
xm, ym, _, _ = ref.get_predicted_positions(YEARS)  # model positions
dx = (np.asarray(ref['x']) - xm)[good] * 1000       # milli-pixels
dy = (np.asarray(ref['y']) - ym)[good] * 1000
print(f"residual scatter: {np.nanstd(dx):.1f} / {np.nanstd(dy):.1f} mpix")
residual scatter: 36.7 / 38.0 mpix
fig, ax = plt.subplots(figsize=(8, 5))
bins = np.linspace(min(dx.min(), dy.min()), max(dx.max(), dy.max()), 60)
ax.hist(dx.ravel(), bins=bins, alpha=0.7, color='steelblue', label='x')
ax.hist(dy.ravel(), bins=bins, alpha=0.7, color='indianred', label='y')
ax.axvline(0, color='k', ls='--', lw=1)
ax.set_xlabel('residual from fitted motion (milli-pixels)')
ax.set_ylabel('count')
ax.set_title(f'Post-alignment residuals  (injected noise {ERR*1000:.0f} mpix)')
ax.legend()
plt.tight_layout()
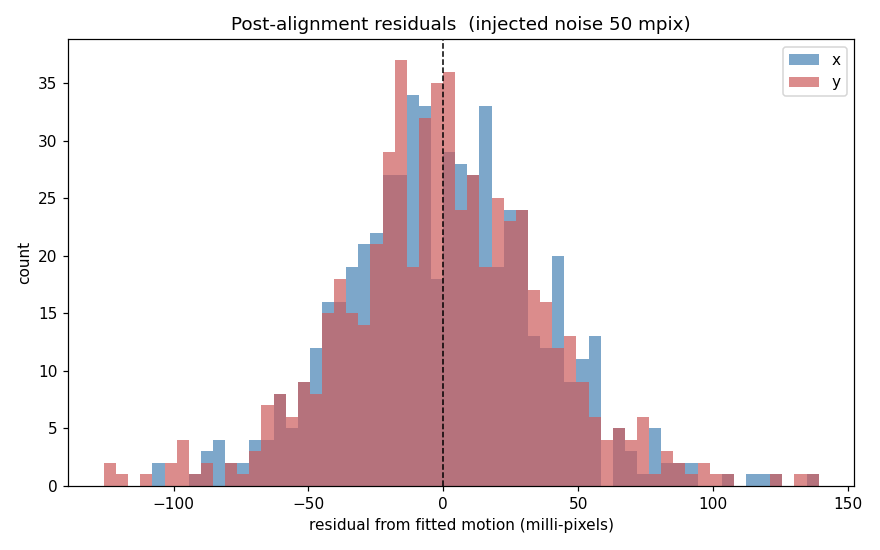
We injected 50 milli-pixels of noise and recovered 37. That is not the alignment beating the noise – it is the expected effect of fitting two parameters per coordinate to four epochs, which absorbs part of the scatter: \(50 \times \sqrt{1 - 2/4} = 35\). Getting 37 is the sign the fit is behaving.
Finally, the proper motions. We never told FlyStar what they were, and the frames were rotating underneath them, so recovering them is the strongest check that the alignment is right:
name_to_i = {n: j for j, n in enumerate(names)}
idx = np.array([name_to_i.get(n, -1) for n in np.asarray(ref['name']).astype(str)])
ok = good & (idx >= 0)
print(f"vx recovered to {np.std(np.asarray(ref['vx'])[ok] - vx[idx[ok]]) * 1000:.1f} mpix/yr")
vx recovered to 19.3 mpix/yr
fig, axes = plt.subplots(1, 2, figsize=(14, 6))
for ax, v_true, v_fit, lab in [
        (axes[0], vx[idx[ok]], np.asarray(ref['vx'])[ok], 'v_x'),
        (axes[1], vy[idx[ok]], np.asarray(ref['vy'])[ok], 'v_y')]:
    ax.scatter(v_true, v_fit, s=25, alpha=0.7)
    lo, hi = min(v_true.min(), v_fit.min()), max(v_true.max(), v_fit.max())
    ax.plot([lo, hi], [lo, hi], 'k--', lw=1)        # 1:1, not a fit
    ax.set_xlabel(f'true {lab} (pix/yr)')
    ax.set_ylabel(f'recovered {lab} (pix/yr)')
    ax.set_title(f'{lab}:  scatter = {np.std(v_fit - v_true)*1000:.1f} mpix/yr')
    ax.set_aspect('equal', adjustable='box')
plt.tight_layout()
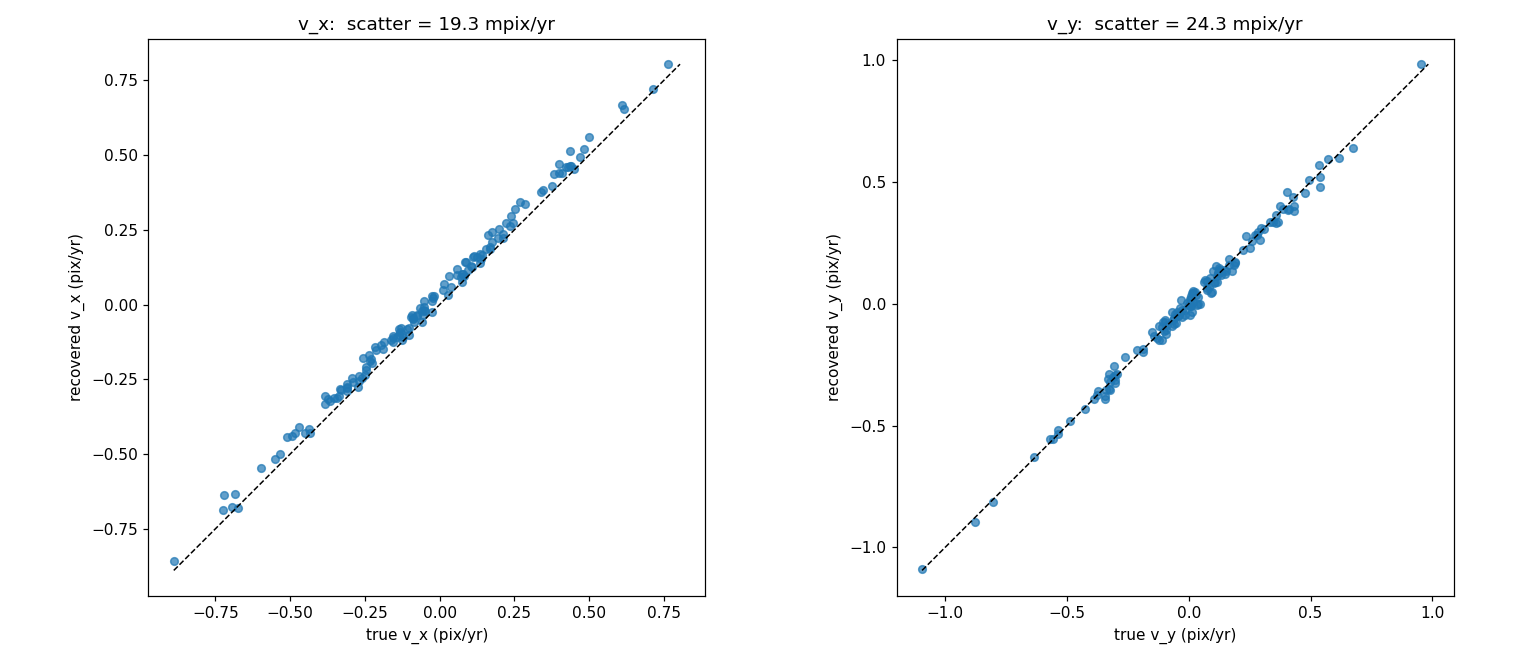
Proper motions recovered to about 20 milli-pixels per year against a 0.05 pixel per-epoch measurement error over a six-year baseline – so the alignment has not absorbed the stellar motion into the frame solution, which is the failure mode that matters here.